Earth and Us
Earth and Us에 대한 설명글입니다.
[Intelligence] Change Detection Using KOMPSAT-5 InSAR Data
- #KOMPSAT
- #InSAR
- #Change Detection
we’re diving into an interesting study that showcases how we can detect changes in the landscape using KOMPSAT-5 InSAR images.
We used two images taken with a standard resolution of 3 meters on August 31 and September 28, 2016, and analyzed them with the PHOTOMOD Radar tool.
Our study area? The beautiful Irkutsk region in Russia!
In the left figure, you can see the two images we worked with, overlapped over the study area.
The yellow rectangle highlights the specific site we focused on for change detection.
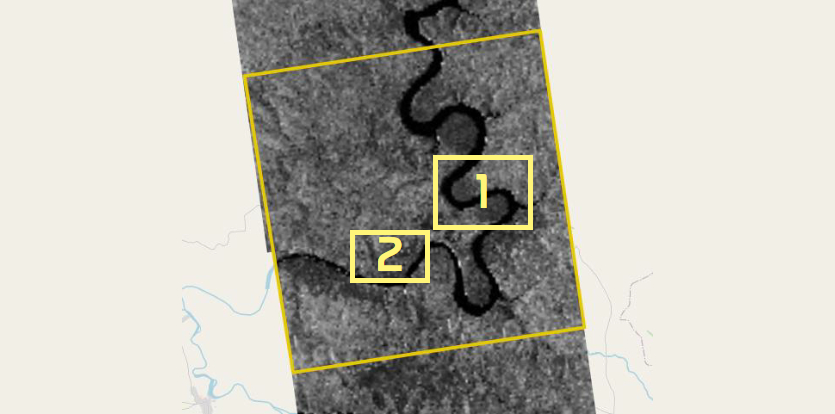
Figure 1. Test Site: Irkutsk Region, Russia
Detecting Logged Areas
Now, let’s talk about logged areas! In Figure 2, you can see the images from our test site taken on the two different dates.
Figure 3 shows the logged areas that Racurs detected over just one month.
By comparing the two scenes, we found that there were logged areas near the river, which is pretty fascinating!
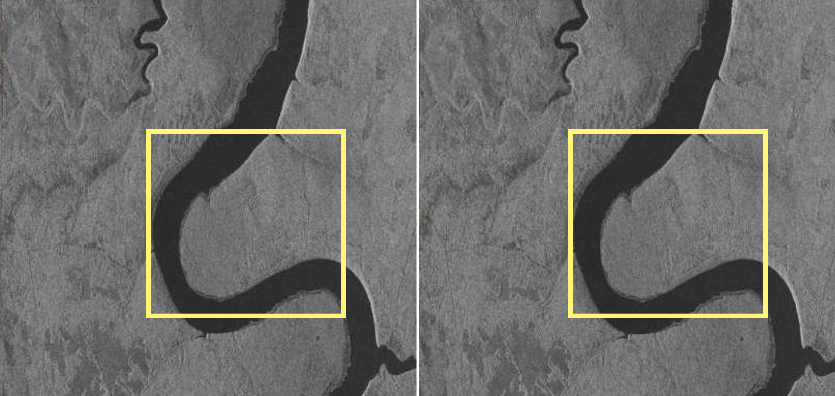
Figure 2. Test site 1 taken respectively on August 31 and September 28, 2016
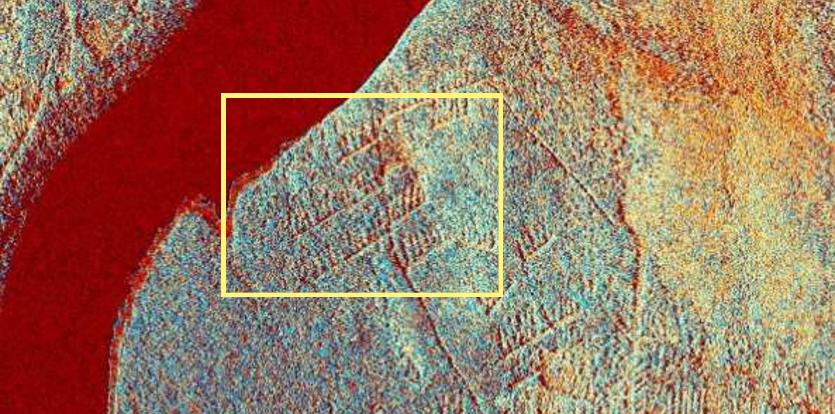
Figure 3. Logged areas
Detecting Changed Areas and Coherent Combining Over Test Site 2
For our second test site, we used a cool feature called "coherent co-registration of SAR images" in the PHOTOMOD Radar tool.
This tool helps us create a set of images that match each other with high accuracy. How does it work? It analyzes the phase values of the pixels in the images.
It’s important to note that the images we use need to be in a complex format and captured under specific conditions for interferometric imagery.
The radar signals bounce back from the Earth’s surface, and their characteristics depend on the surface geometry at the radar wavelength scale.
This means we can detect changes at different scales!
By processing two complex interferometric SAR images together, we create a coherence image.
Analyzing this coherence image allows us to see changes in both the intensity and phase of the backscattered signals.
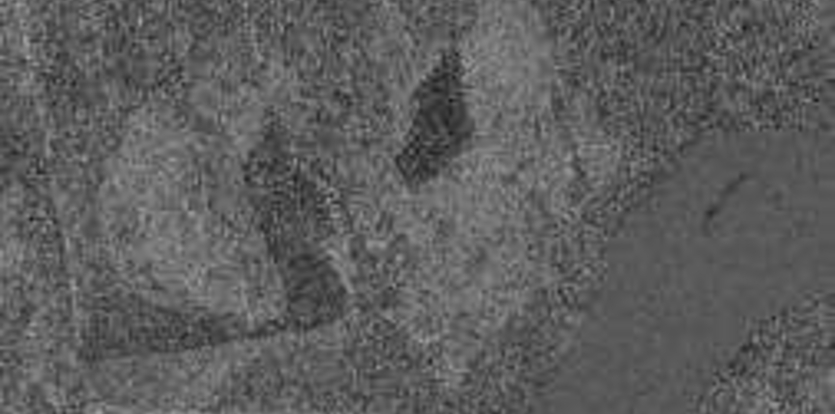
Figure 4. Difference visualization
 \
\
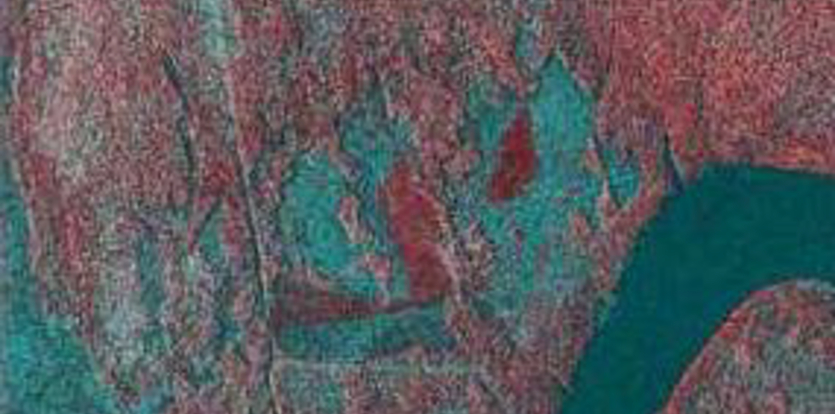
Figure 5. Difference in false color image
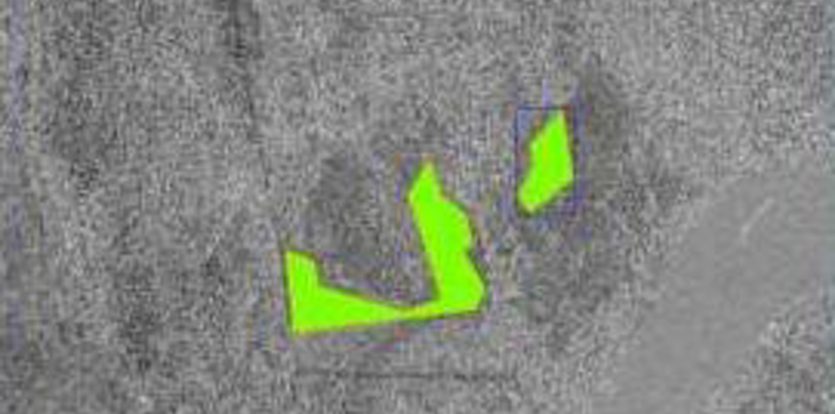
Figure 6. Vectorization
Figures 4 and 5 show how we visualize the differences we detected.
Figure 4 gives a clear difference visualization, while Figure 5 presents the changes in a false color image.
And in Figure 6, you can see how we vectorized the detected changes, making it easier to understand what’s happening in the landscape.
We have explored the process of detecting changes using the KOMPSAT-5 satellite InSAR images.
Thanks to the PHOTOMOD software, we learned that we can effectively detect changes even with the 3m resolution images from the KOMPSAT-5 satellite!
The adverse effects of extensive logging can lead to increased water levels in rivers surrounding forests, resulting in nearby villages experiencing more frequent flood damage than before, as well as a higher risk of landslides.
During the logging process, only the trunks of the trees are taken, leaving the branches scattered in the forest. This can lead to large-scale wildfires due to the accumulation of dry branches.
Using satellite images allows us to observe vast areas at a glance, which is beneficial for protecting forest environments!
I look forward to seeing how change detection technology using satellite images will be applied in various places in the future!
💾 Clicking the icon will take you to the data download page.
Source: © Racurs / © KARI / © SIIS


