Earth and Us
Earth and Us에 대한 설명글입니다.
[Intelligence] Change Detection Analysis Using KOMPSAT-5 SAR Imagery
- #KOMPSAT
- #SAR
- #Change Detection Analysis
- #Study
We will explore a study conducted by Senior Researcher Dochul Yang from the Korea Aerospace Research Institute(KARI) on how to Change Detection Analysis using SAR imagery from KOMPSAT-5.
In this research, the software SNAP S1TBX (version 7.0) was utilized to perform change detection analysis.
SAR change detection is a technique that involves comparing SAR images taken of the same area at different times to observe and identify changes.
There are two main types of this method: Amplitude Change Detection (ACD) and Coherence Change Detection (CCD).
First, ACD is the most common method for detecting changes by comparing the intensity information of the images.
This method is efficient for detecting significant changes, making it effective for identifying alterations in artificial structures like buildings and vehicles.
A typical ACD approach involves comparing two images and calculating the logarithmic ratio.
On the other hand, CCD uses the phase coherence of two SAR images to detect changes.
This method is primarily used to identify very subtle changes, typically in the mm to cm range, which may be difficult to detect with ACD.
Now, let’s look at two case studies.
The first case is in Glendale, Arizona, and the second case is at Jurong Port in Singapore.
Let’s explore the changes detected in these two regions!
Case 1.

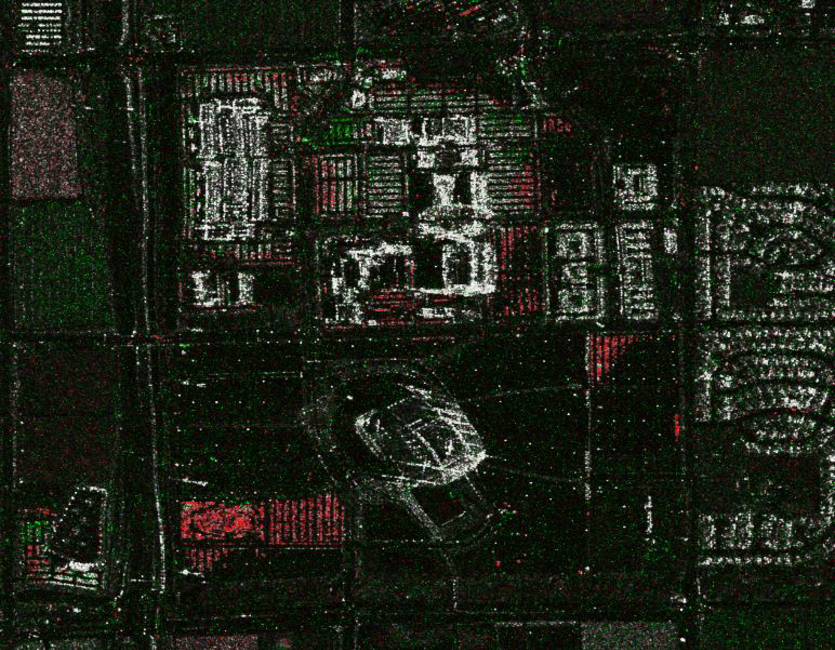
KOMPSAT-5 ES mode Change detection image over Glendale in Arizona, USA
Glendale is located about 14 km (9 miles) northwest of downtown Phoenix.
Changes were detected in the large parking lots near the University of Phoenix Stadium and the Glendale Sports and Entertainment District.
KARI analyzed two images captured by KOMPSAT-5, taken on March 31, 2019, and April 28, 2019.
These images have a resolution of 2.5m and a swath width of 30km.
By comparing the amplitudes of the two images, changes in the positions of cars in the center of Glendale were identified.
The areas marked in red indicate newly parked cars, while the green areas show where cars have disappeared.
It’s fascinating how satellite imagery can easily reveal changes in parking lots!
Case 2.

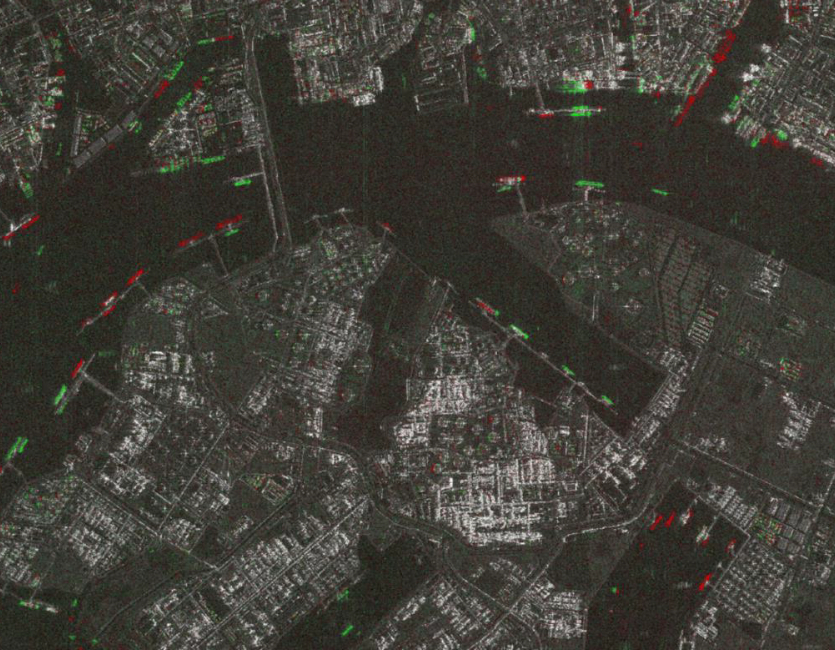
KOMPSAT-5 ST mode Change detection image near the Jurong Port in Singapore
The second case focuses on Jurong Port in Singapore.
This international multipurpose port supports regional and domestic industries such as construction, shipbuilding, offshore, and manufacturing.
Change detection was also conducted here using KOMPSAT-5.
In this case, standard imaging mode (ST) was used to analyze images with a resolution of 3m.
In these images, the green areas represent floating ships and containers, while the red areas indicate newly appeared features.
The changes at Jurong Port were clearly identified through satellite imagery.
These two case studies demonstrate the successful application of KOMPSAT-5 SAR imagery for change detection.
Notably, for smaller areas, using the spotlight imaging mode (with a resolution of 0.85m and a swath width of 5km) allows for even clearer detection of changes.
The technology of change detection using satellite imagery has great potential for various fields, including urban development and environmental monitoring.
The future advancements in this area are certainly something to look forward to!
💾 Clicking the icon will take you to the data download page.
Source: ©KARI / ©SIIS


